Where studies stand
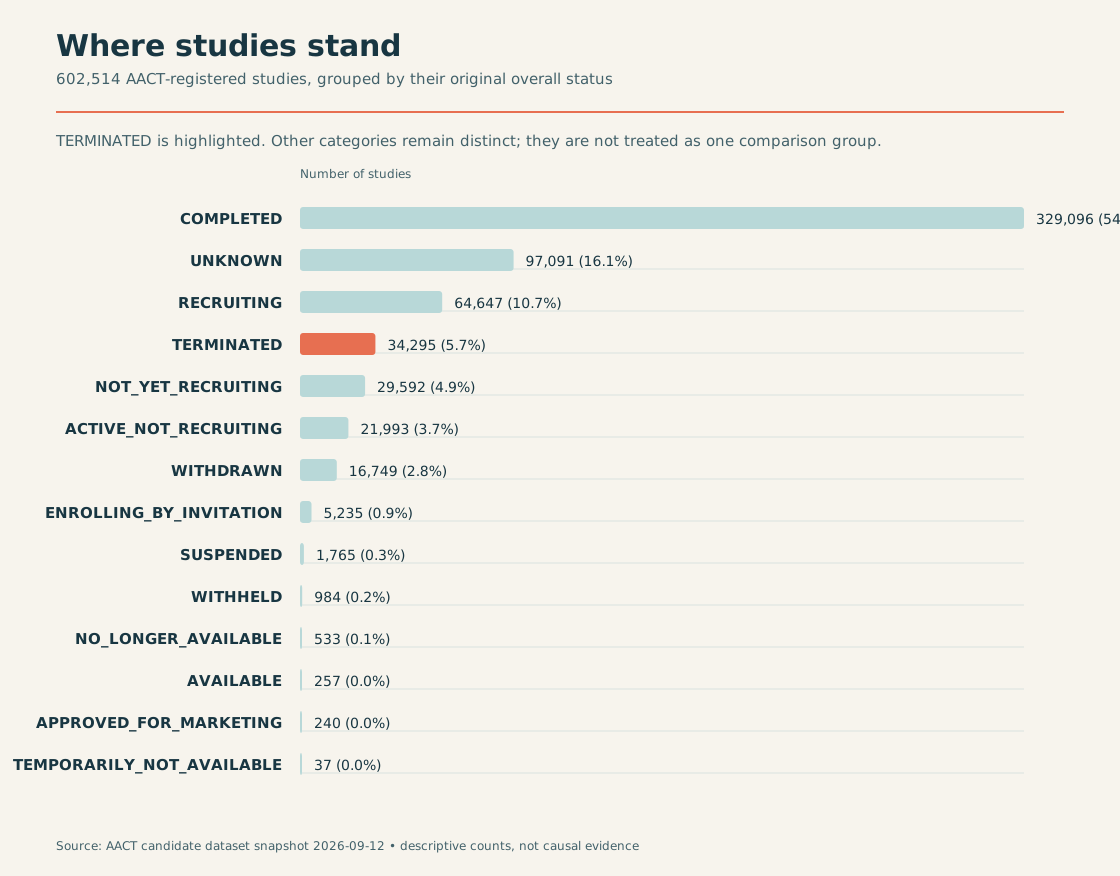
This foundational view captures all 602,514 registered clinical studies in the Aggregate Analysis of ClinicalTrials.gov (AACT) candidate dataset, maintaining each reported status category independently.
A central finding immediately emerges: 34,295 studies were explicitly marked TERMINATED (representing 5.7% of all registered trials, and 9.4% of closed completed or terminated trials). Rather than treating trial termination as a rare anomaly, the data reveals that premature study termination is a recurring challenge across the clinical research enterprise.
NoteKey Takeaway from Status Distribution
While completed studies represent the largest single group (329,096 trials), over 34,000 trials halted prematurely. Understanding the operational, design, and clinical factors associated with these terminations provides a blueprint for early detection and prevention.
Therapeutic Areas & Disease Distribution
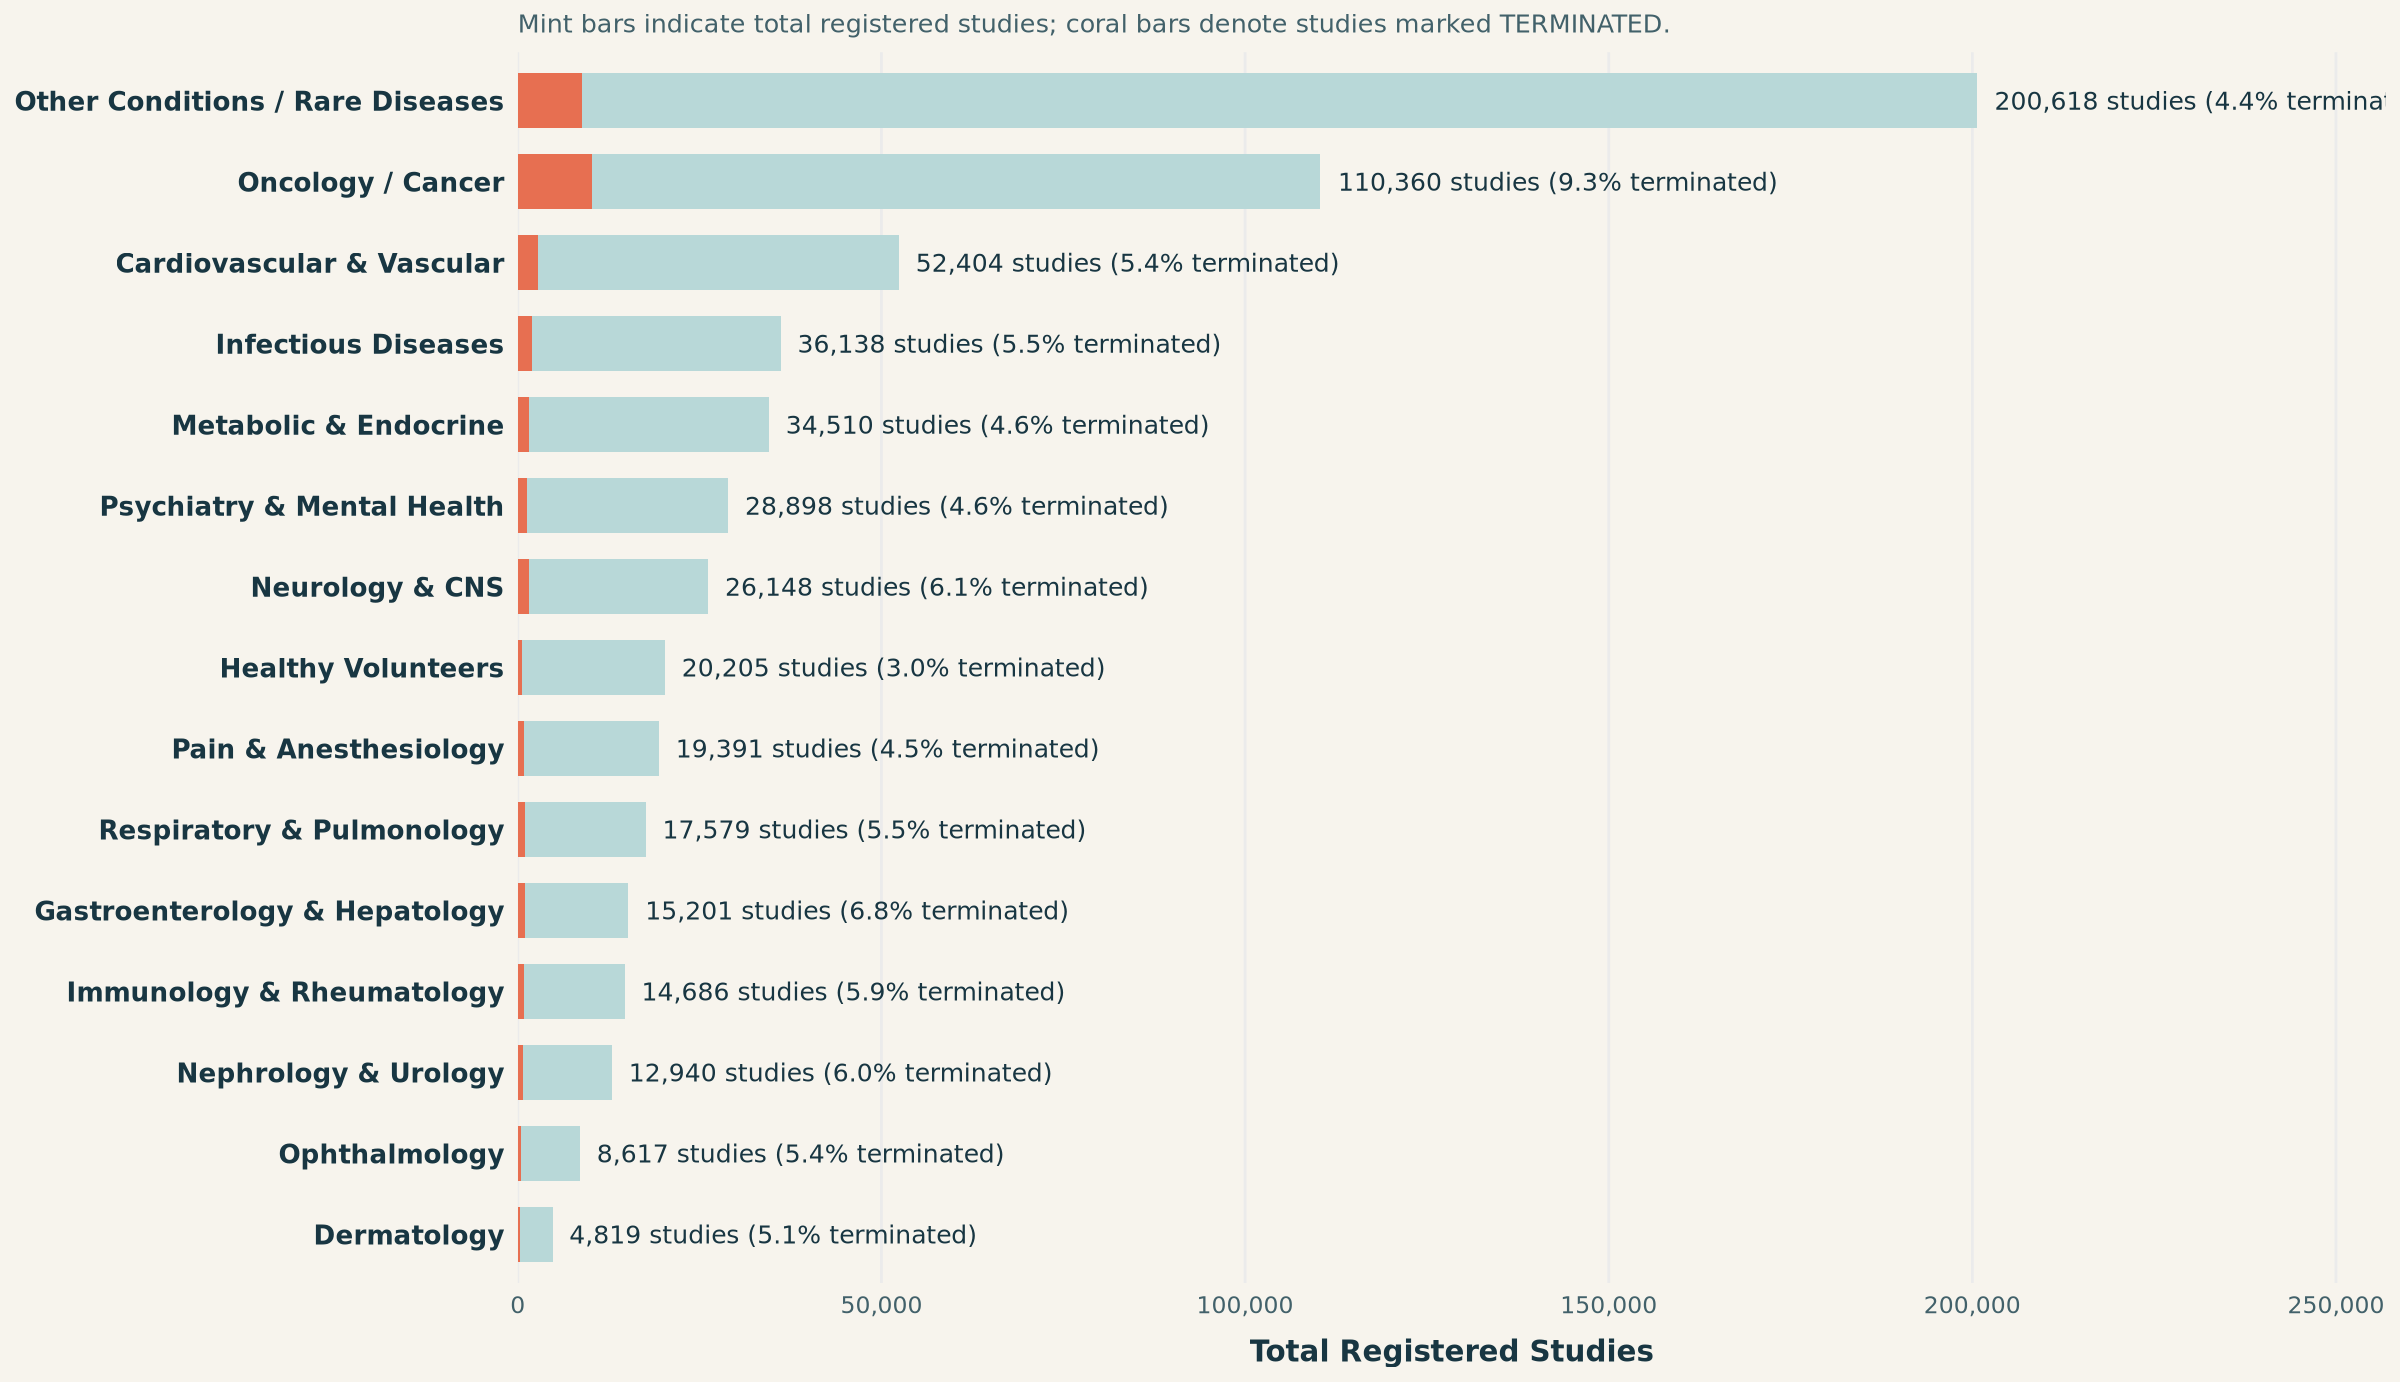
Clinical trial volume and termination vulnerability vary widely across medical disciplines. The statistics chart below maps registered trials and termination rates across major therapeutic areas:
NoteTherapeutic Area Insights
- Oncology Dominance & Risk: Oncology / Cancer represents the largest identified clinical indication with 110,360 studies (18.3% of all trials), and simultaneously exhibits the highest termination rate at 9.3% (over 10,200 terminated trials). Oncology trials face severe patient accrual hurdles due to narrow biomarker inclusion criteria and toxicities.
- Healthy Volunteer Baseline: Studies on healthy volunteers and normal controls display the lowest termination rate (3.0%), underscoring that patient disease severity and complex eligibility directly elevate termination hazard.
What do individual trials look like over time?
Each point on this chart is one study plotted by its start year and planned enrollment. Coral points are studies marked TERMINATED; teal points are all other status categories. The logarithmic y-axis keeps small and very large studies visible together.
2. Interactive Panel of Histograms: Enrollment Distribution by Era
The histogram panel below details the distribution of participant enrollment across four distinct historical eras: 1990–1999, 2000–2009, 2010–2019, and 2020–2026. Use the toggle buttons above the chart to view each era individually with clean, wide bars and direct percentage labels, or select “Compare All” to view the side-by-side comparison.
NoteKey Insights from Enrollment Distribution
- Convergence on Modern Target Sizes: In the 1990s (prior to mandated registry reporting), recorded trials were disproportionately large landmark trials. Since the mid-2000s, clinical research has settled into a consistent distribution, with the bulk of trials enrolling between 25 and 250 participants (typical Phase I–II studies).
- The Long Tail of Mega-Trials: While median trial size has remained relatively stable (~60–80 patients), roughly 10% of trials plan for 1,000+ participants, introducing dramatic operational complexity and multi-site coordination risks.
Important Note
Correlation does NOT equal causation. Instead, data related to the risk factors for the termination of drug trials are merely associated with drug trial failure. Identifying these statistical associations allows research teams to flag operational vulnerabilities and implement risk-mitigation strategies early in trial planning.